
Leads and axis
R-wave progression and the transition zone
The precordial axis
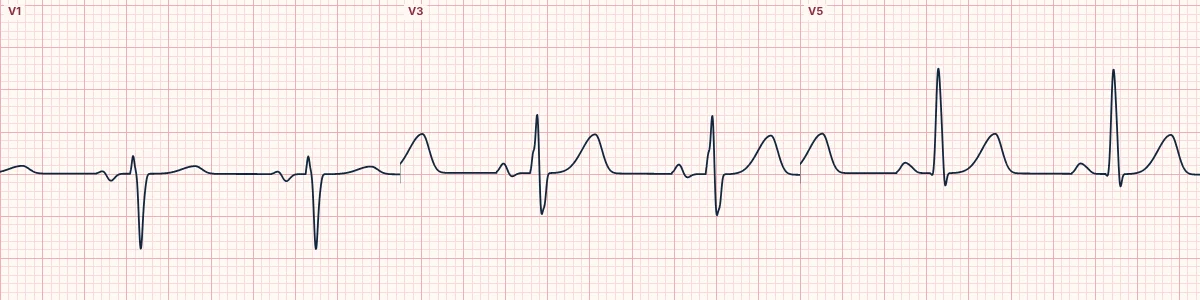
Across V1 to V6 the R wave normally grows and the S wave shrinks, crossing over (R = S) in V3 or V4. Where that transition sits tells you which way the QRS points in the horizontal plane.
Why the R wave grows
The left ventricle dominates, so the main QRS vector points left and slightly back. V1 sees it moving away (a small r and deep S), V6 sees it coming toward it (a tall R), and the leads in between show a gradual change.
Early transition
R ≥ S by V1 or V2 means the horizontal axis has swung forward (counterclockwise rotation). Consider right bundle branch block, posterior infarction, right ventricular hypertrophy, pre-excitation, dextroposition or a normal variant in young people.
Late transition and poor progression
R still smaller than S in V5 or V6 means the axis has swung backward (clockwise rotation). Consider left bundle branch block, left ventricular hypertrophy, anterior infarction, chronic lung disease and misplaced chest electrodes.
See it in 3D
Switch the heart panel to Chest leads 3D. The QRS loop and its shadow on the horizontal plane show exactly which electrodes the vector points toward, and the R/S bars mark the transition lead.
How to read it
- Follow the R wave from V1 to V6; it should grow steadily.
- Find the first lead where R is at least as large as S.
- Compare the transition with the rest of the ECG before blaming rotation.
Pitfalls
- High placement of V1–V3 can cause apparent poor R-wave progression.
- A dominant R in V1 is never just rotation until posterior infarction and RBBB are excluded.
Frequently asked questions
R-wave progression and the transition zone: what is the key idea?
Across V1 to V6 the R wave normally grows and the S wave shrinks, crossing over (R = S) in V3 or V4. Where that transition sits tells you which way the QRS points in the horizontal plane.
R-wave progression and the transition zone: what are the key numbers?
Normal transition: V3–V4; Early: V1–V2; Late: V5–V6; Poor R progression: R < 3 mm in V3.
R-wave progression and the transition zone: how do you apply it to an ECG?
Follow the R wave from V1 to V6; it should grow steadily. Find the first lead where R is at least as large as S. Compare the transition with the rest of the ECG before blaming rotation.
R-wave progression and the transition zone: what are the common pitfalls?
High placement of V1–V3 can cause apparent poor R-wave progression. A dominant R in V1 is never just rotation until posterior infarction and RBBB are excluded.